A scorecard someone has to act on.
If everyone has seen the numbers but nobody knows what to do next, the weekly meeting has missed the point. I want to know who will do what before the next one.
In episode 122 of Noll till 100, we discuss breaking down a growth target until someone can do the work. That is what I want from a scorecard too. Revenue needs margin, customers, inventory and cash alongside it. Then someone needs to decide what the numbers mean for the coming week. Here is a template for doing that work.
What will you do with the numbers on Monday?
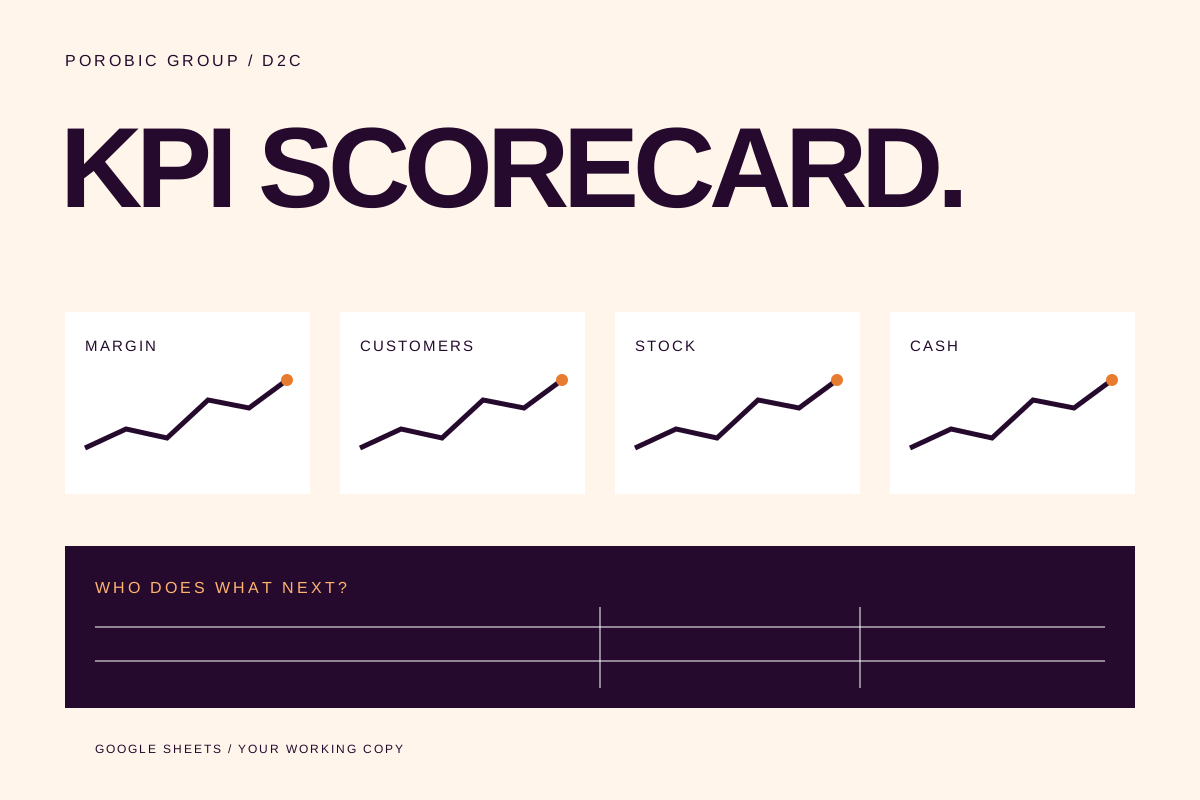
A D2C KPI scorecard covering margin, acquisition, inventory and cash. Keep your targets, owners and next actions together.
- Separate weekly and monthly reviews.
- Defined margins, CAC, repeat purchases and cash metrics.
- Blank inputs for your results, plus a separate fictional example.
- Set your own targets and decide who acts next.
What would make you change the plan?
I am happy to look at twenty metrics. I am less interested in spending twenty minutes on each one, then doing exactly what we did last week. Start with the decisions you need to make: increase the budget, order stock, change the offer or work out why customers are not coming back.
Connect the metrics to those decisions. Choose what to review weekly and what needs a closed month. Give someone responsibility and write down the action when results miss the target. Otherwise the same red cell becomes a regular item on the agenda.
Include the cost of making the sale.
Revenue tells you how much you sold. I also want to see what remains after product cost, returns, delivery, payment fees and marketing. Decide which costs each margin includes and use the same definition next week. Changing the definition halfway through a chart is an excellent way to fool yourself.
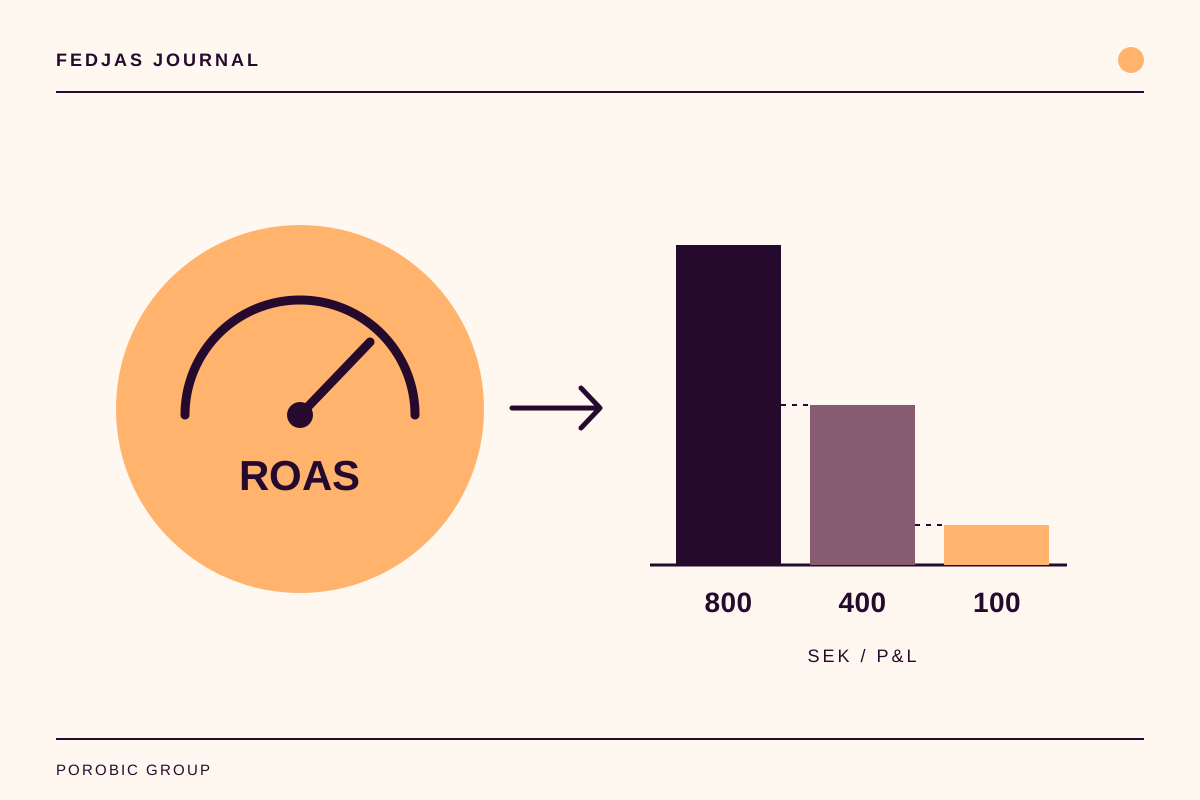
The ad platform’s ROAS can have a place in the analysis. It cannot, by itself, tell you whether the company can afford to sell more. A bigger budget needs to be judged against the business that will pay for it.
Who bought, and what did it cost?
Separate new customers from returning ones. Look at acquisition cost and what the order contributes, but follow whether previous customers actually buy again. A high share of returning orders can mean that new customer sales are falling. That is why I want counts as well as percentages.
Do not mix the ad platform’s estimated customers with the store’s actual new customers without saying so. Record the source and period. A missing number should remain visibly missing. Zero means you measured it and got zero.
You still have to pay for the next stock order.
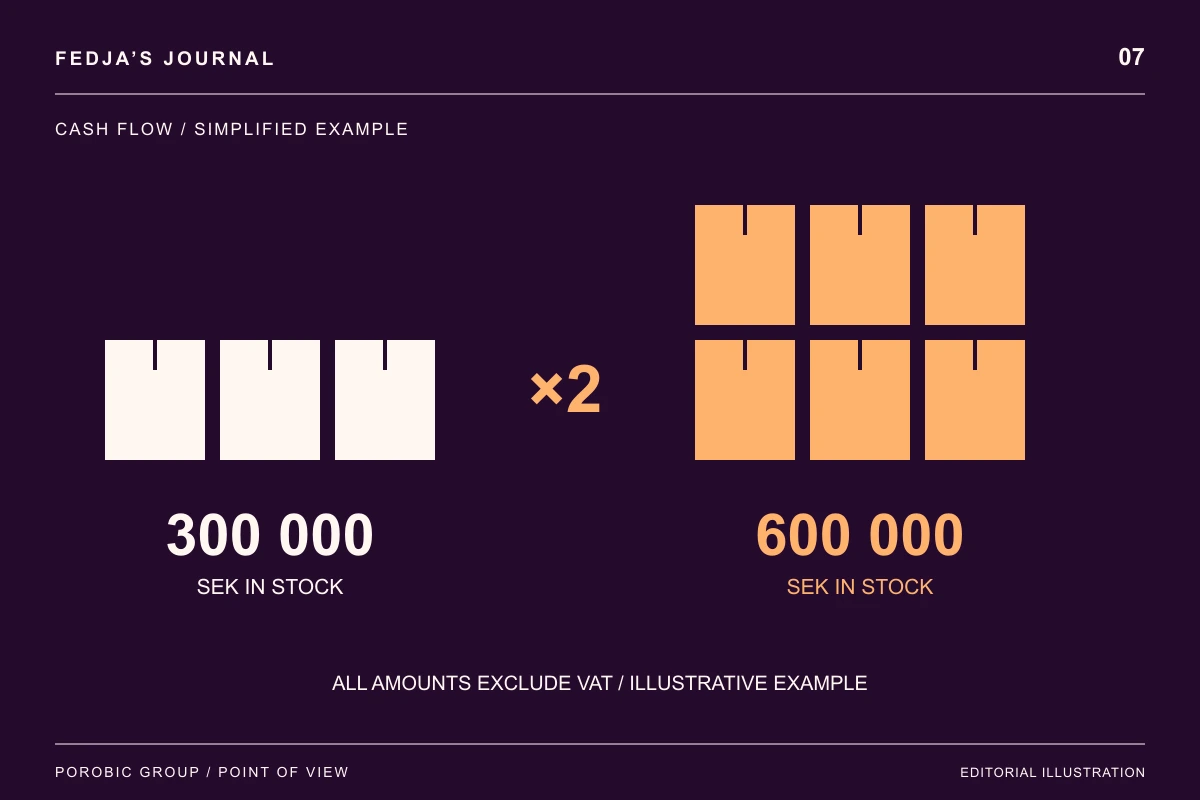
Growth needs products to sell and cash to buy them. Review inventory and cash alongside sales. Total stock can look reassuring while the bestseller runs out and another product sits untouched. Open the product plan and forecast before ordering more of everything.
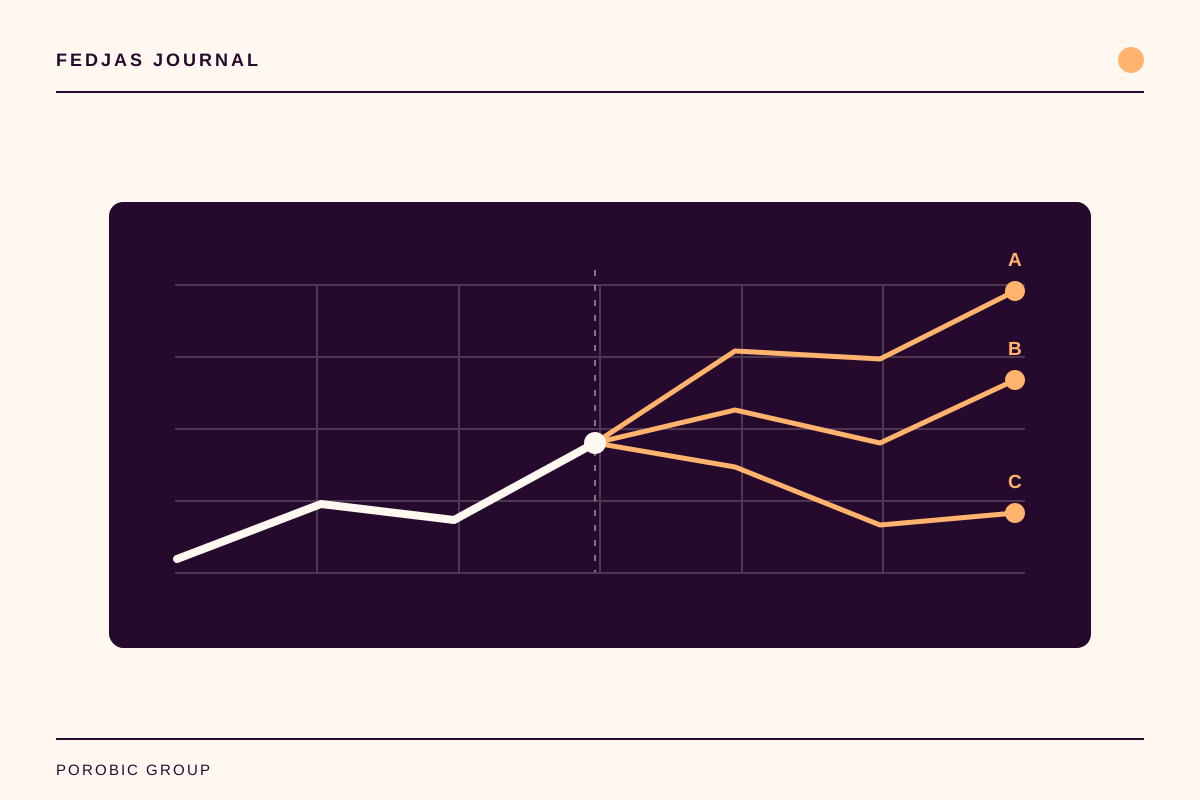
That is also why I want a comparison with the plan. Which assumption failed? Do we need to address it or revise the coming months? A variance is useful when it makes us ask a better question.
Enter your numbers. Agree on the next step.
Make your own copy of the template. Keep examples separate from actual results, choose targets that fit your products and put the right person in charge of each question. Example figures and targets demonstrate the approach. They are not benchmarks for what an ecommerce business should achieve.
Then hold a meeting with the sheet in front of you. Agree what you will do, who will do it and when you will follow up. If nothing changes in the work, we need better questions or fewer cells.

Fedja Porobic
Founder of Porobic Group. I write about advertising, ecommerce and the decisions that determine whether a business makes money.
Meet the Porobic Group team